In today’s episode, you’ll hear answers to 2 recent listener questions about Academic Writing Task 1.
Listen in for tips you need to get 7+.
We’ll also share errors you must avoid in order to get the score you need on IELTS!
Academic Task 1 is arguably the most difficult part of the IELTS exam.
Writing about graphs and charts is not something most of us have experience with!
Understanding how to write a high-scoring overall trend is half the battle!
For all the strategies you need for 7+ on every part of the exam, sign up for 3 Keys IELTS!
See IELTS study as a fun process!
Our mindset and outlook when we’re studying makes a huge difference with its efficacy.
If it’s drudgery, you’re not going to learn anything.
It will take forever to get the score you need.
If, instead, you make it fun, engaging and interesting, you will enjoy it!
The result will be that you will retain much more!
Question #1: Numbers and dates in the introduction
Do we have to add specific numbers in the introduction paragraph in Writing Task 1?
No, you cannot have specific numbers in the overall trend.
This is different for years.
You can provide the years for the graph when you describe it in the first setnence.
However, you cannot provide specific numbers and data from the graphs?
Strategies Created by a Former IELTS Examiner

100% Score Increase Guarantee with our Insider Method
Are you ready to move past IELTS and move forward with your life vision?
Find out why our strategies are the most powerful in the IELTS world.
When you use our Insider Method you avoid the BIGGEST MISTAKES that most students make on IELTS.
Click here to get a score increase on IELTS. It’s 100% guaranteed.
Why can’t you share specific numbers in the overall trend?
As soon as you share specific information, it’s no longer an “overall trend.”
The overall trend shares the general information that is shown overall in the graphs or charts.
- What information increases or decreases?
- Which numbers are the highest and lowest?
All specific numbers and information should be reserved for body paragraphs.
Overall trend for Change Over Time charts
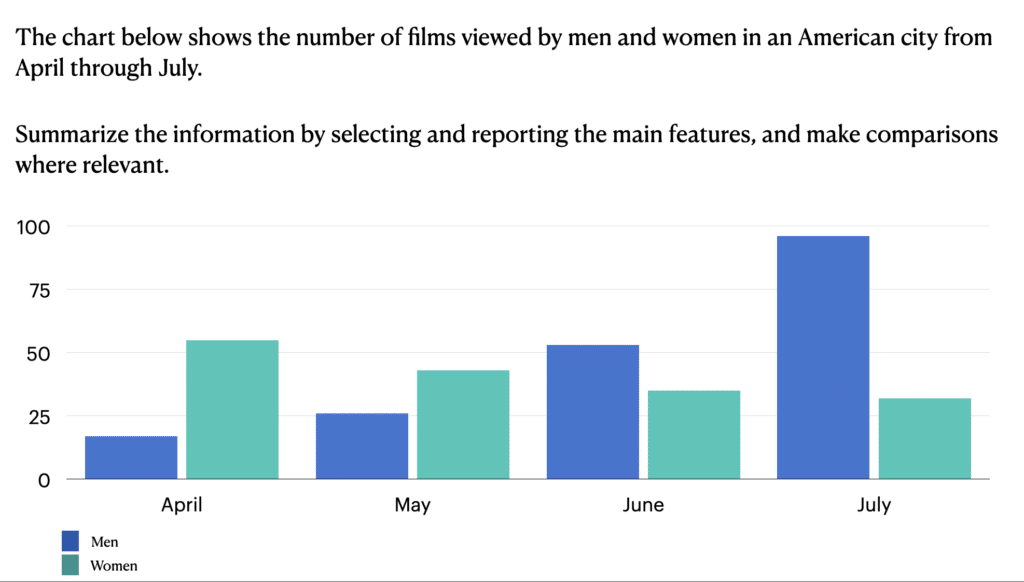
The bar graph below is what we call a Change Over Time graph.
This is because it shows information for multiple dates, allowing us to see how the information changed over time.
Static essays, on the other hand show a snapshot of one moment in time.
The overall trend for a Change Over Time will be different from a Static essay.
You want to share what increased and decreased.
Time to practice!
What overall trend would you write for the Academic Task 1 below?
Write it in the comments!

Remember not to include specific numbers!
Model overall trend for this chart
Overall, the quantity of male moviegoers skyrocketed markedly, while the amount of females plunged dramatically.
Yours does not have to match ours word for word!
There are many ways to phrase an overall trend.
If you didn’t include specific numbers and shared what increased and decreased overall, you did it right!
However, notice the band 9 adverbs and verbs here.
- skyrocketed markedly
- plunged dramatically
The overall trend is an excellent place to boost your Vocabulary score!
Where should the overall trend go?
Many students ask if they should put the overall trend in a body paragraph or a conclusion.
You are allowed to put it anywhere.
However, there are specific reasons we recommend putting it in the introduction.
First, you’re not required to have a conclusion.
It doesn’t help your score at all.
Additionally, it takes time that would be better spent elsewhere!
If you don’t put it in the introduction, you’ll only have a 1-sentence introduction.
Paragraphs need at least 2 sentences!
It makes the most sense to restate the topic and then provide the overall trend in the intro.
Question #2: What is the trend?
You may see that an overall trend is required by the scoring system, but not know how to look at a chart and figure out what it is!
The overall trend is what is being shown overall in the graph or chart.
You need to understand the function of the graphs.
There are only 2.
- Change Over Time
- Static
For Change Over Time, the overall trend describes the change.
Does it go up or go down?
For static, the function is comparing numbers.
The trend will be the highest and the lowest numbers.
An error to avoid
You might have two charts that show very different information.
A Task 1 we saw recently showed reasons adults decide to study in a bar graph.
A pie chart is also given that shows how people think these costs should be shared.
You cannot say in your overall trend, “Overall, both illustrations demonstrate…”
This is because they’re showing such different information!
Strategy for 2 charts
Whenever there are 2 or more images, you will need 2 clauses or 2 sentences for your overall trend.
You can’t put them all together, or it makes your overall trend inaccurate.
This pulls your Task Response score down to a 5!
A template for this can be:
Overall, [overall trend for bar graph]; in addition, [overall trend for pie chart].
Takeaway
When it comes to Academic Task 1, it’s vital you know how to write an accurate overall trend.
This is one of the hardest things about IELTS, because most of us have never analyzed charts before!
You need strategies that make it easy!
You must understand the function of the graphs and for each one, what that means for the overall trend.
Once you have this insider information, it’s a matter of practice!
In addition, you have to keep improving your overall English and vocabulary so you can write about any topic!
To find out what you would get if you took IELTS today, take our free, 2-minute quiz!
What questions do you have from today’s episode?
Please leave a comment below.


